Organic Takes on Data Visualization and Branding “Heroix” Part 4

Picture of admin

admin

"Organic Data"
"Organic Data 07"

In the pursuit of making complex data more comprehensible and engaging, the traditional methods of pie charts and bar graphs have long stood as the paradigms of information display.

However, with ‘Heroix’, we sought to challenge these norms, to delve into a more naturalistic portrayal of pathways that resemble the intricate workings of the human brain. The goal was to create infographics that not only informed but also inspired, tapping into the organic and often chaotic beauty of opportunity and decision-making.

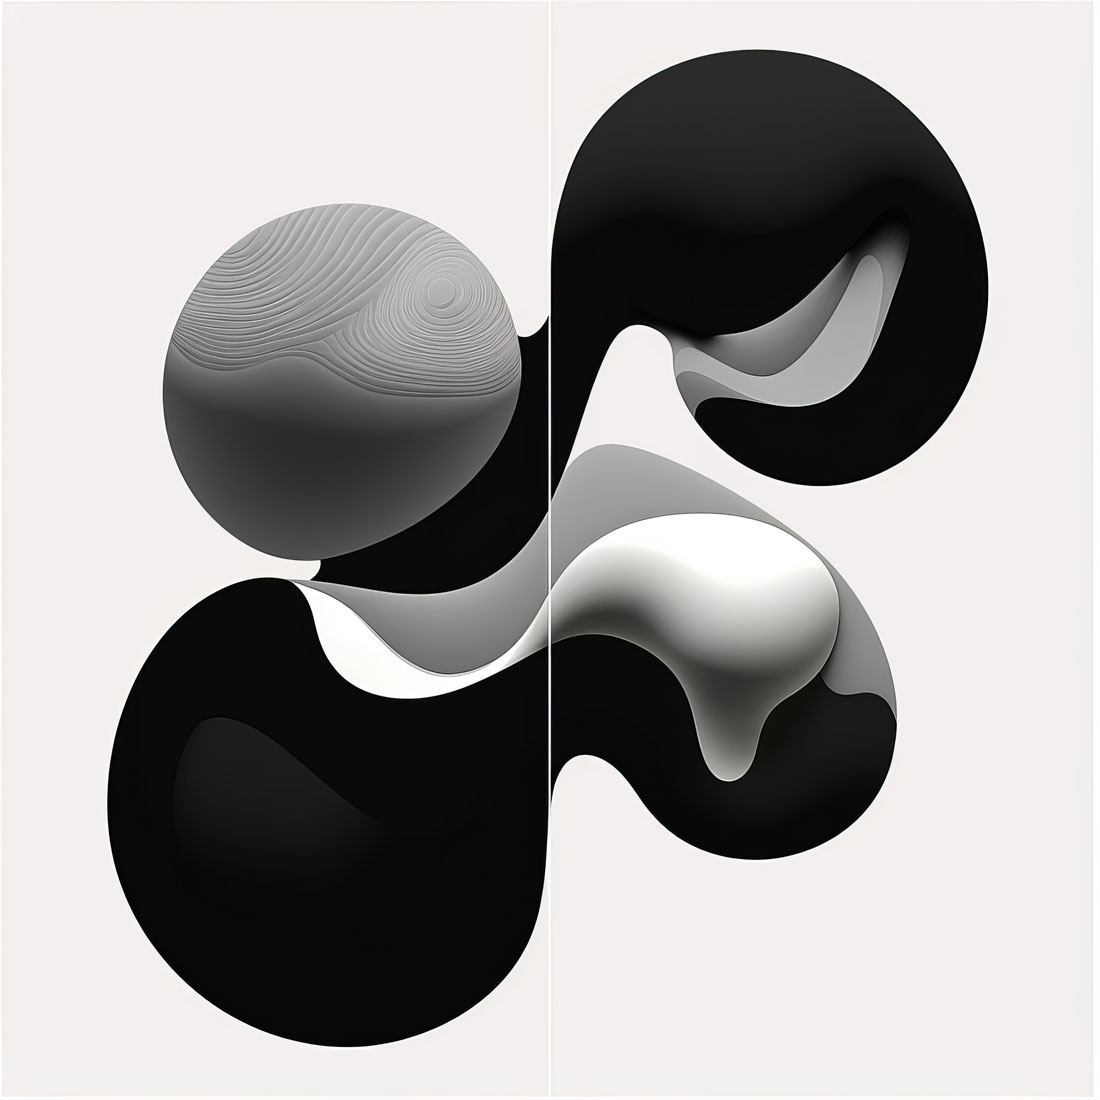
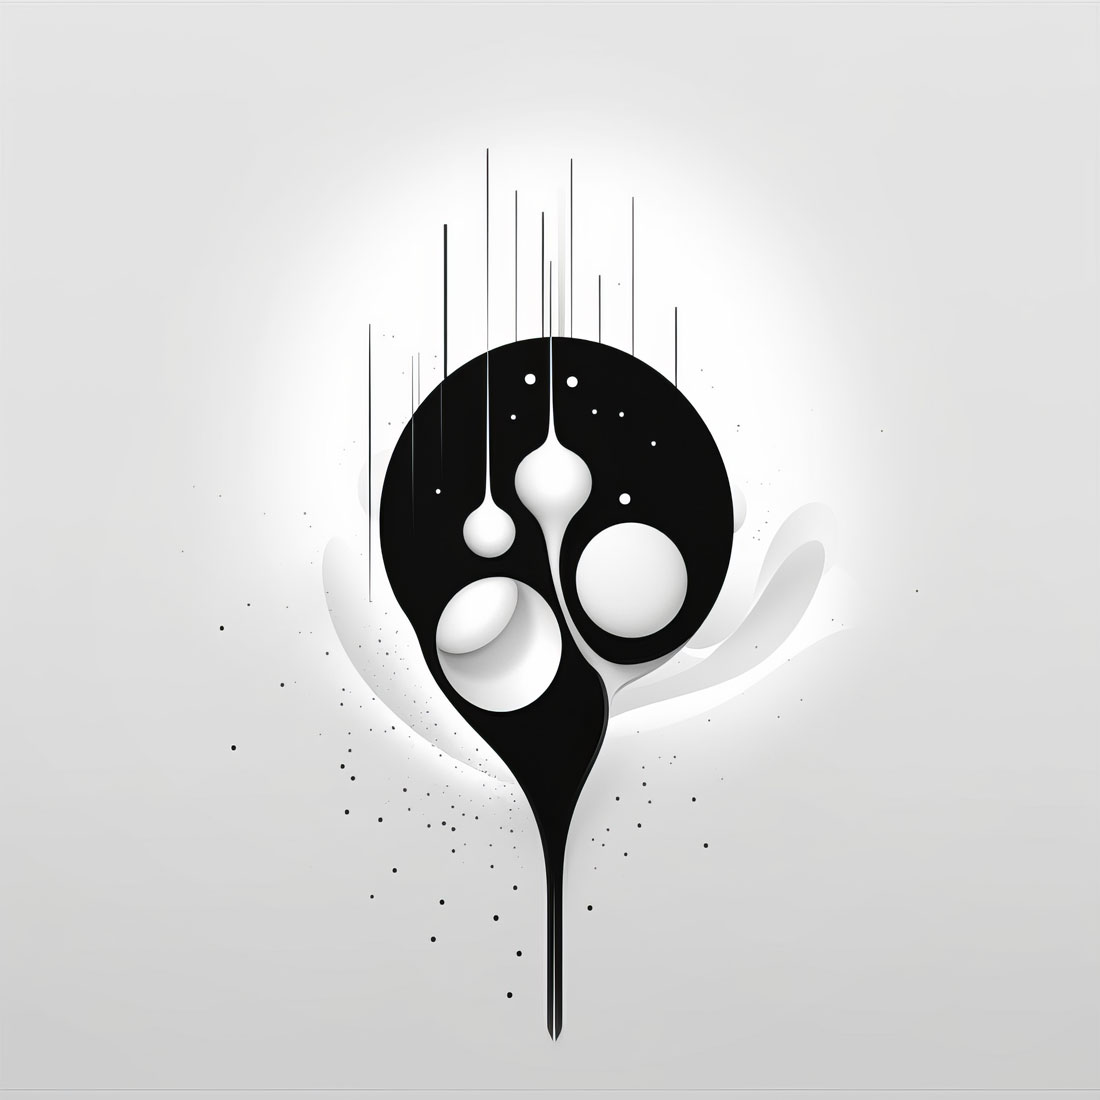
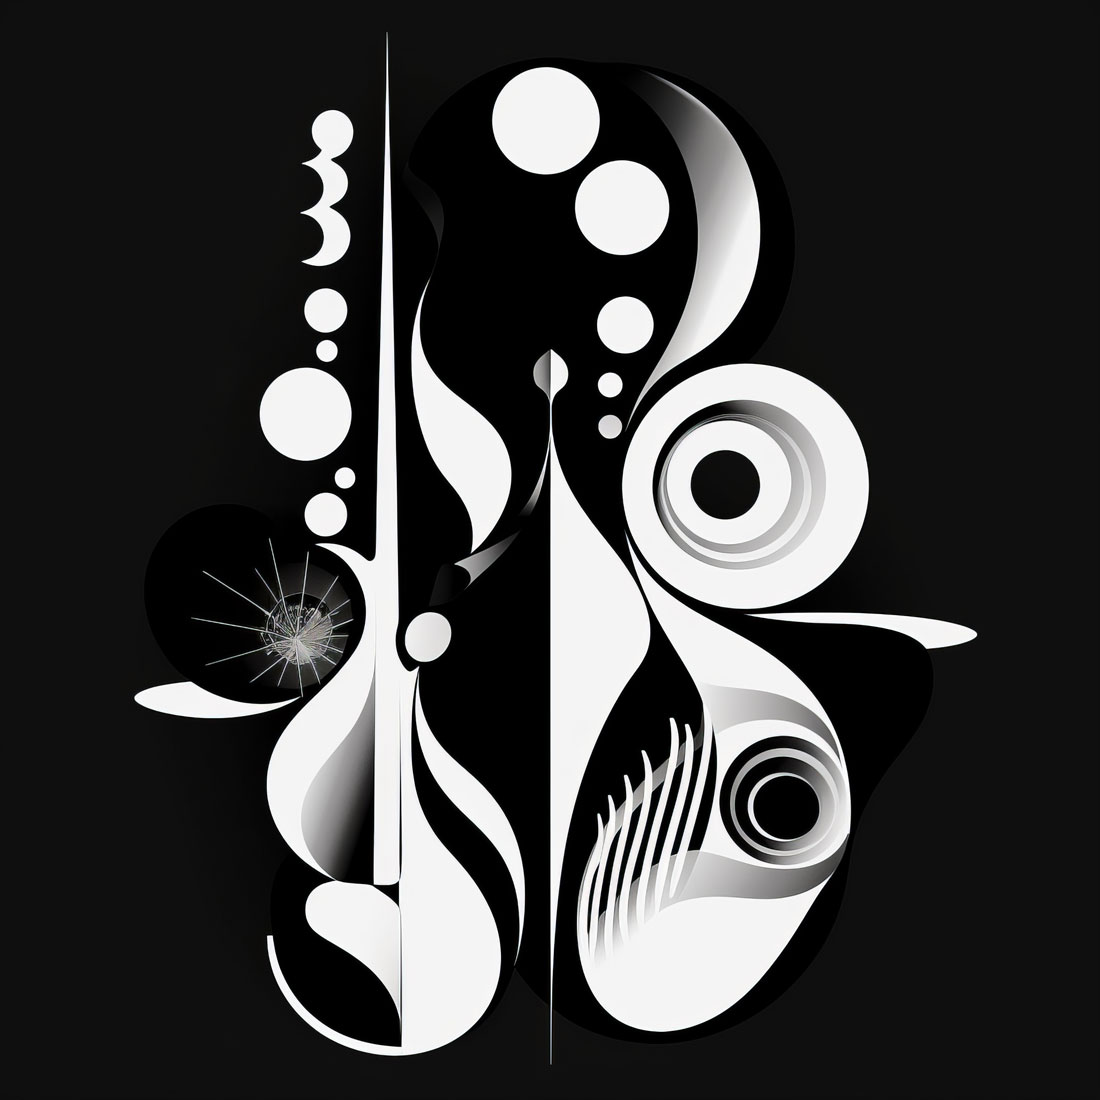
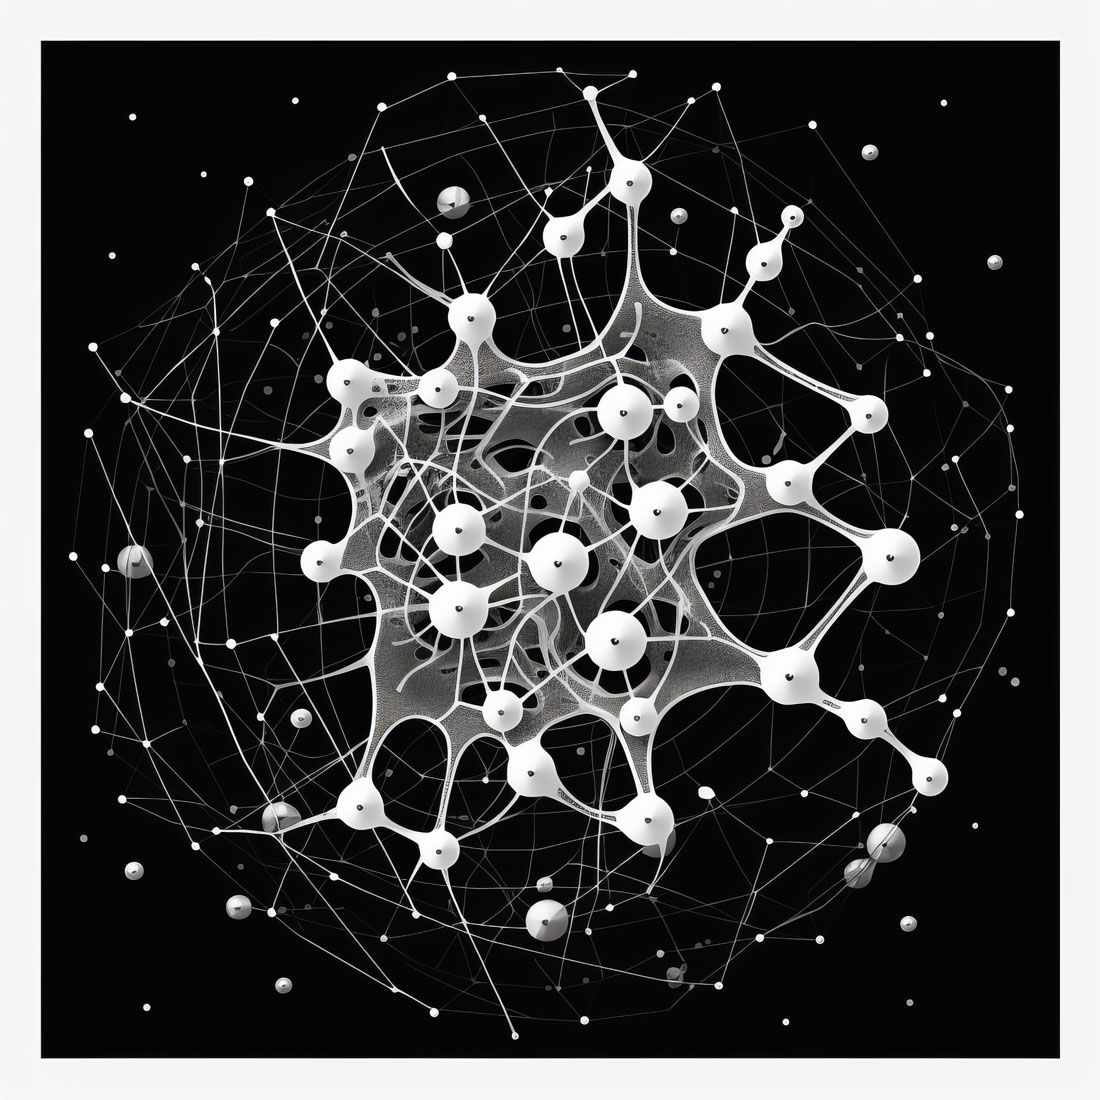
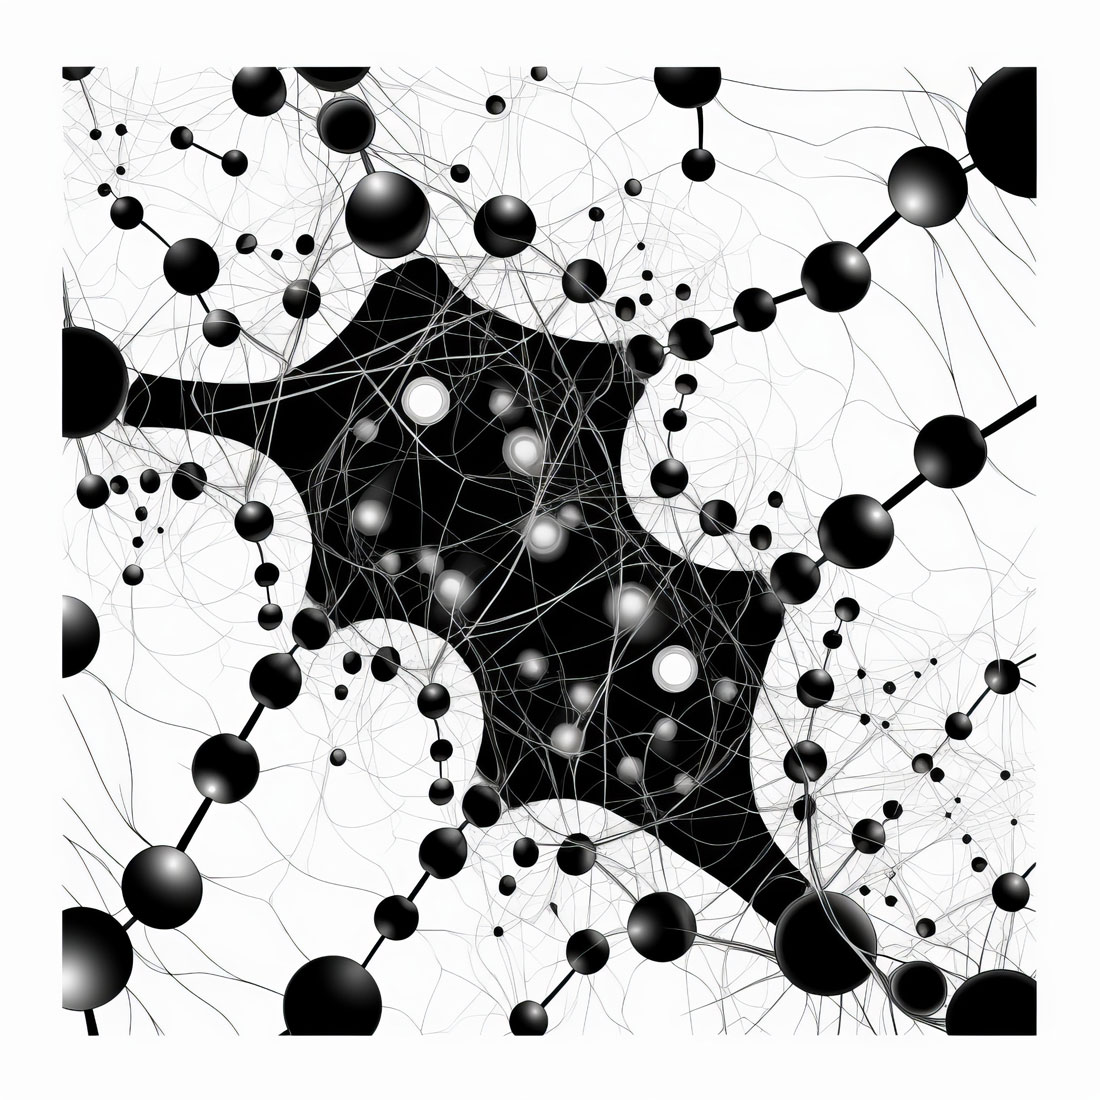
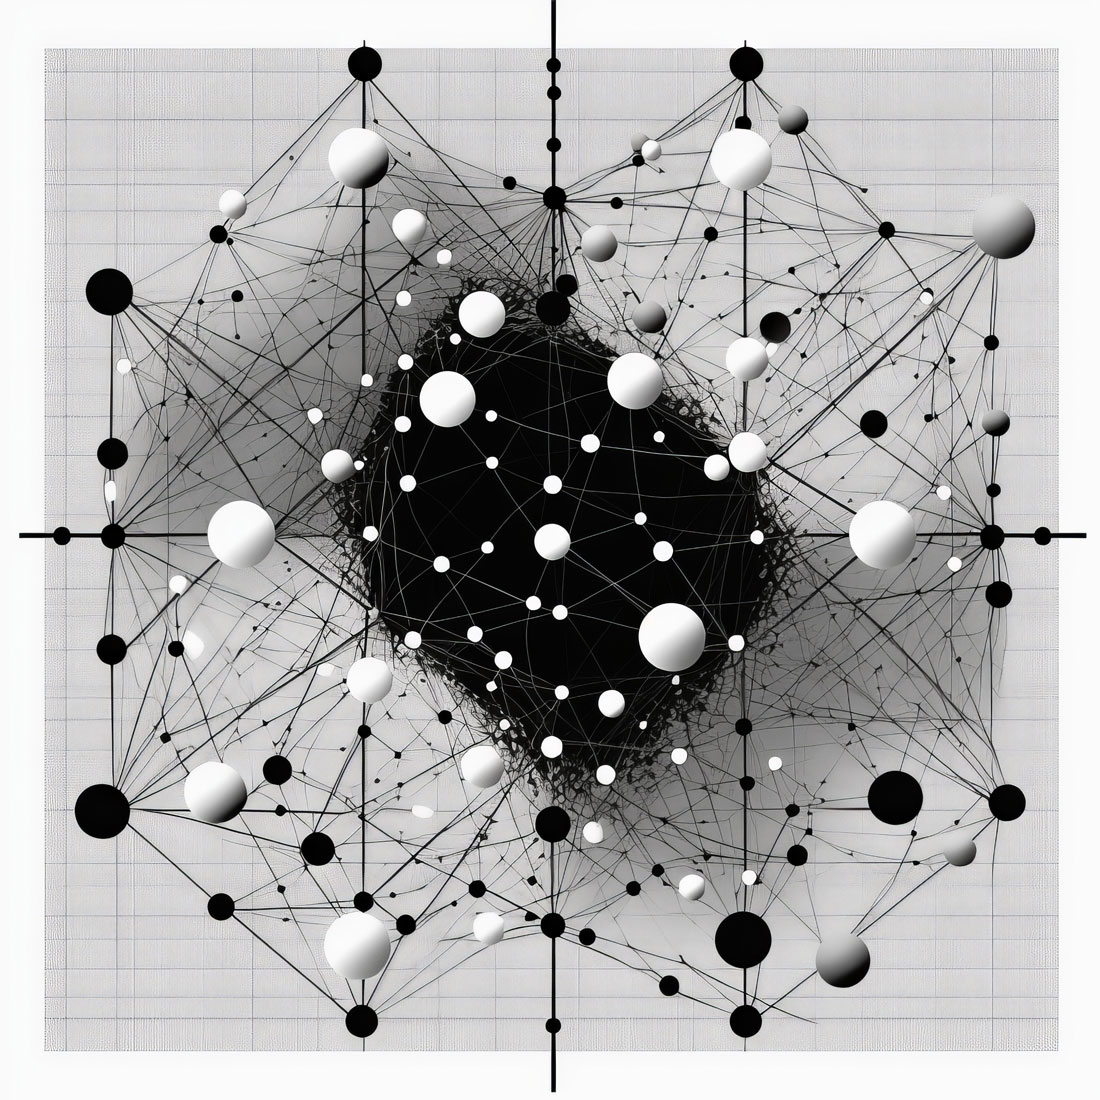
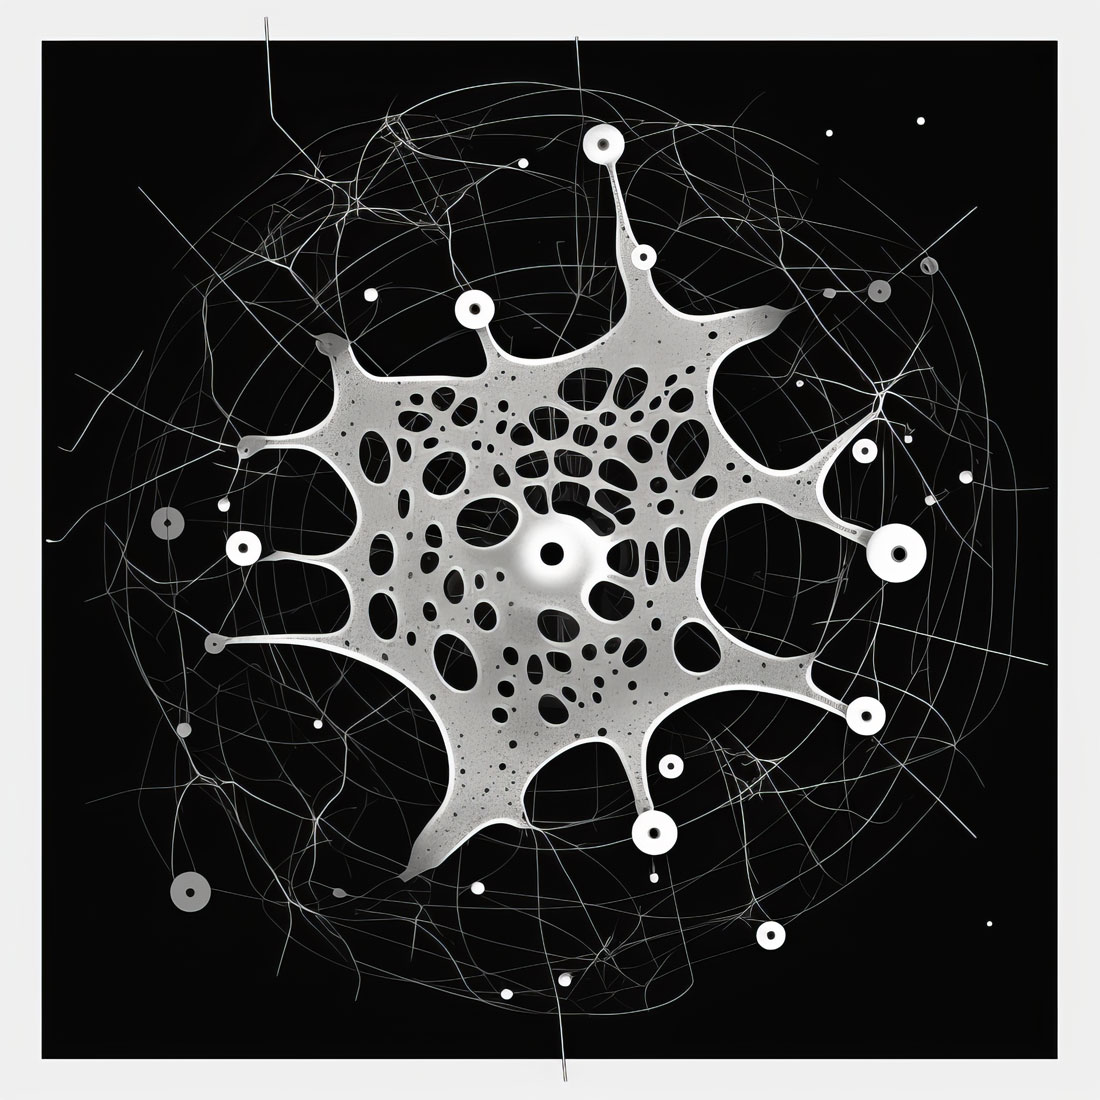
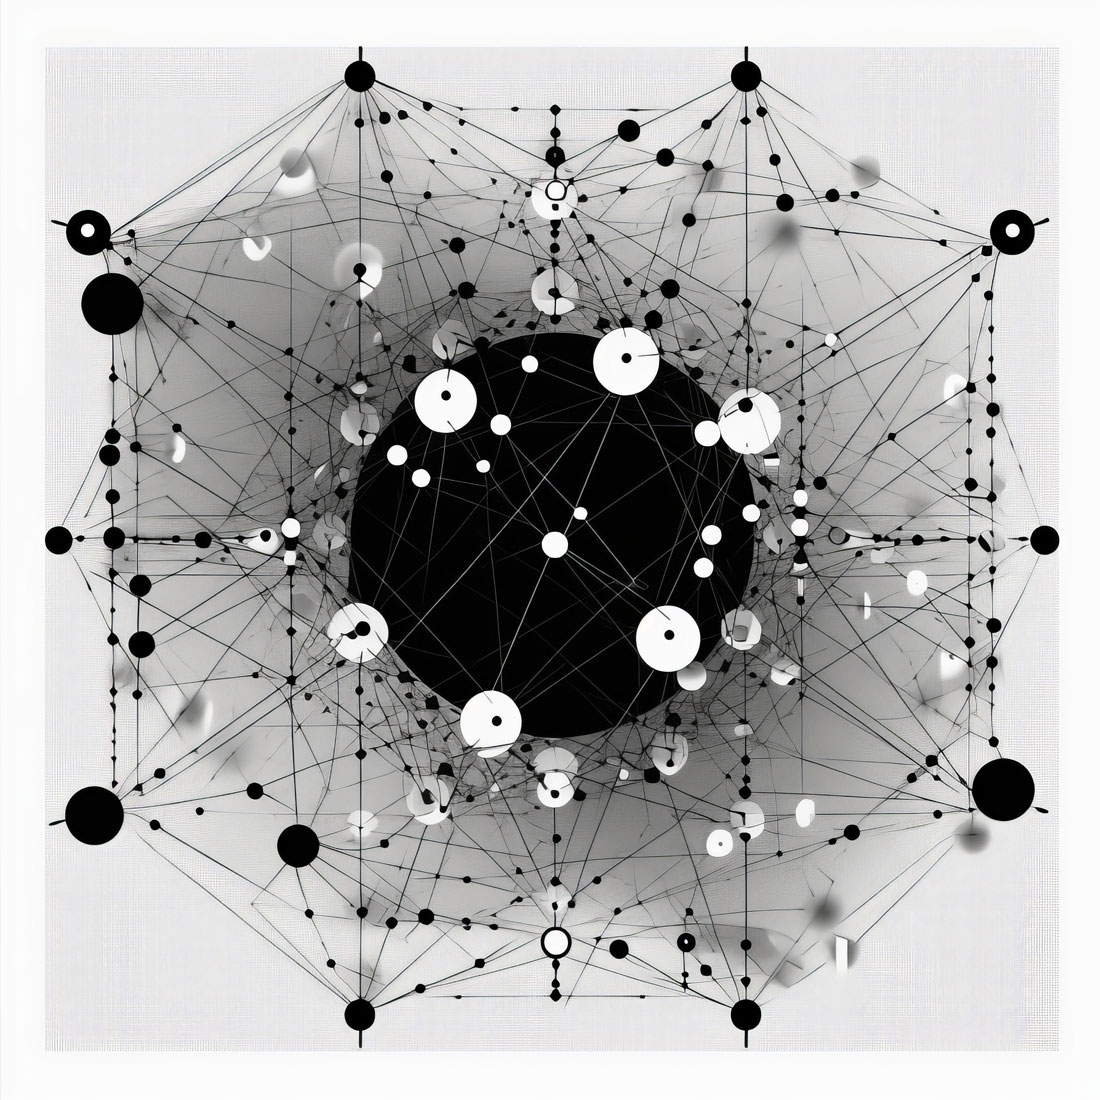
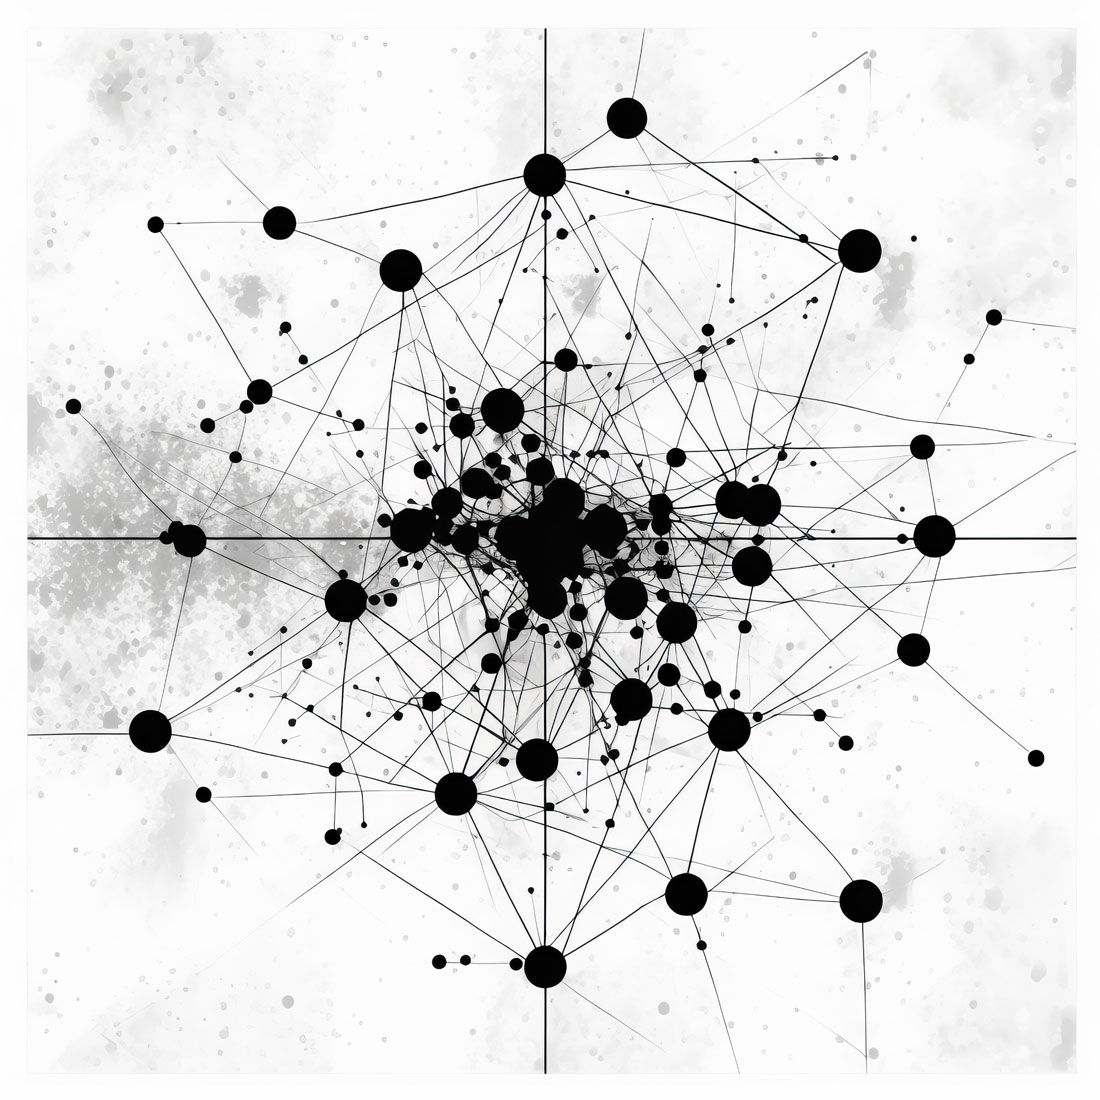
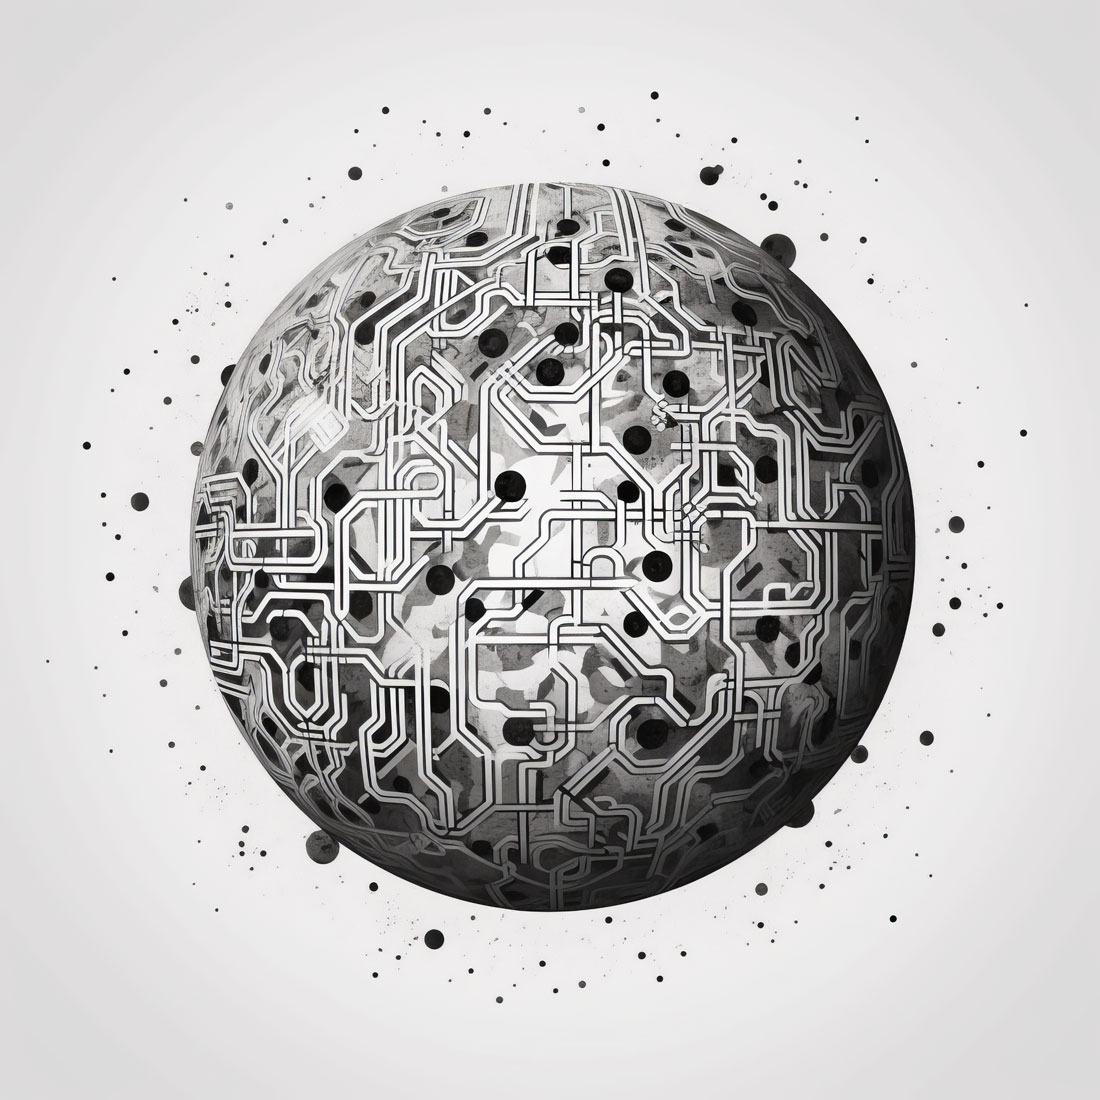
The AI, with its seemingly innate sense for abstraction, crafted visuals that transcended conventional infographics. It provided us with a series of designs that were reminiscent of neural networks, with interlinked nodes and synaptic pathways, rendered with an artistic flair that captivated the imagination. These ‘blobular’ shapes, as we came to refer to them, were like snapshots of cognition, representations of the fluid and dynamic nature of thought and opportunity.

Excitement burgeons at the potential these organic infographics have for visual innovation within data representation. They promise a departure from the rigidity of traditional diagrams, offering instead a visual experience that is more intuitive and reflective of the complex processes they aim to illustrate. This approach could redefine how we perceive and interact with data, inviting viewers to engage with statistics and probabilities not as static figures, but as living, breathing entities. The AI’s contribution to this part of the ‘Heroix’ branding exercise has been pivotal, opening new doors to how we visualize and interpret the wealth of information that defines our paths in a world brimming with potential.